10 Infographics for Learning
We all love infographics. Why? Well, they help us grasp information in a quick and fun way that appeals to our visual senses. In fact, there’s an infographic here explaining that. Below you’ll find 10 infographics that discuss learning in many different capacities – online, blended, mobile, etc. Tell us, what’s your favorite infographic on learning?
1. “Blended Learning: A Disruptive Innovation”
Knewton published an infographic on “Blended Learning: A Disruptive Innovation” that explores K-12 blended learning models by Innosight Institute and Charter School Growth Fund.

2. “Are We Wired for Mobile Learning?”
Voxy Blog published an infographic titled “Are We Wired for Mobile Learning?” that looks at how digital natives are better suited to learn with mobile or digital devices rather than basic tools that are used in the classroom today.

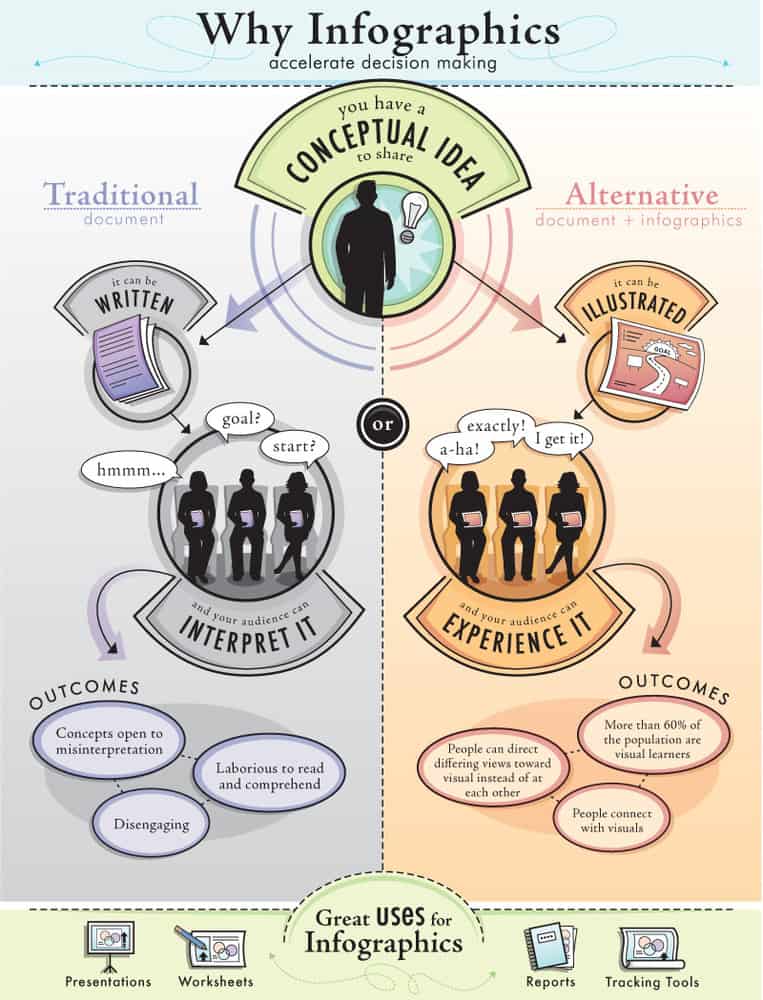
3. “Why infographics accelerate decision making”
Rick Man posted an infographic, “Why infographics accelerate decision making,” that identifies the ways we traditionally present information versus the visual way we can present information through infographics. His infographic proposes that visual representations help audiences better understand new information and ideas because more than 60 percent of people learn visually.

4. “Mapping the Nation’s Well-Being”
Matthew Bloch and Bill Marsh published an interactive map, “Mapping the Nation’s Well-Being,” on the New York Times this March. The map shows, among other categories, the percentage of people that said that they learned something yesterday in Gallup’s random phone poll that asked about indicators of people’s quality of life. Alaska and Hawaii were among the state with the highest responses that said yes.

5. “The Evolution of Online Education Technologies”
Rasmussen College published an infographic titled “The Evolution of Online Education Technologies” that explores the evolution of learning from the 1700s through the Millenium. This infographic projects that 81 percent of higher education students will take at least one online course by 2014. Are colleges and universities prepared to accomodate students online?

6. “How the Internet is Revolutionizing Education”
Mashable published the “How the Internet is Revolutionizing Education” infograhic, which identifies major milestones in technology development that changed the classroom environment. According to the information listed here, online learning is a $34 billion industry that is growing at an “astronomical rate.” It also emphasizes that online learning can provide students with custom-designed learning that allows them to move at a pace appropriate for the individual.

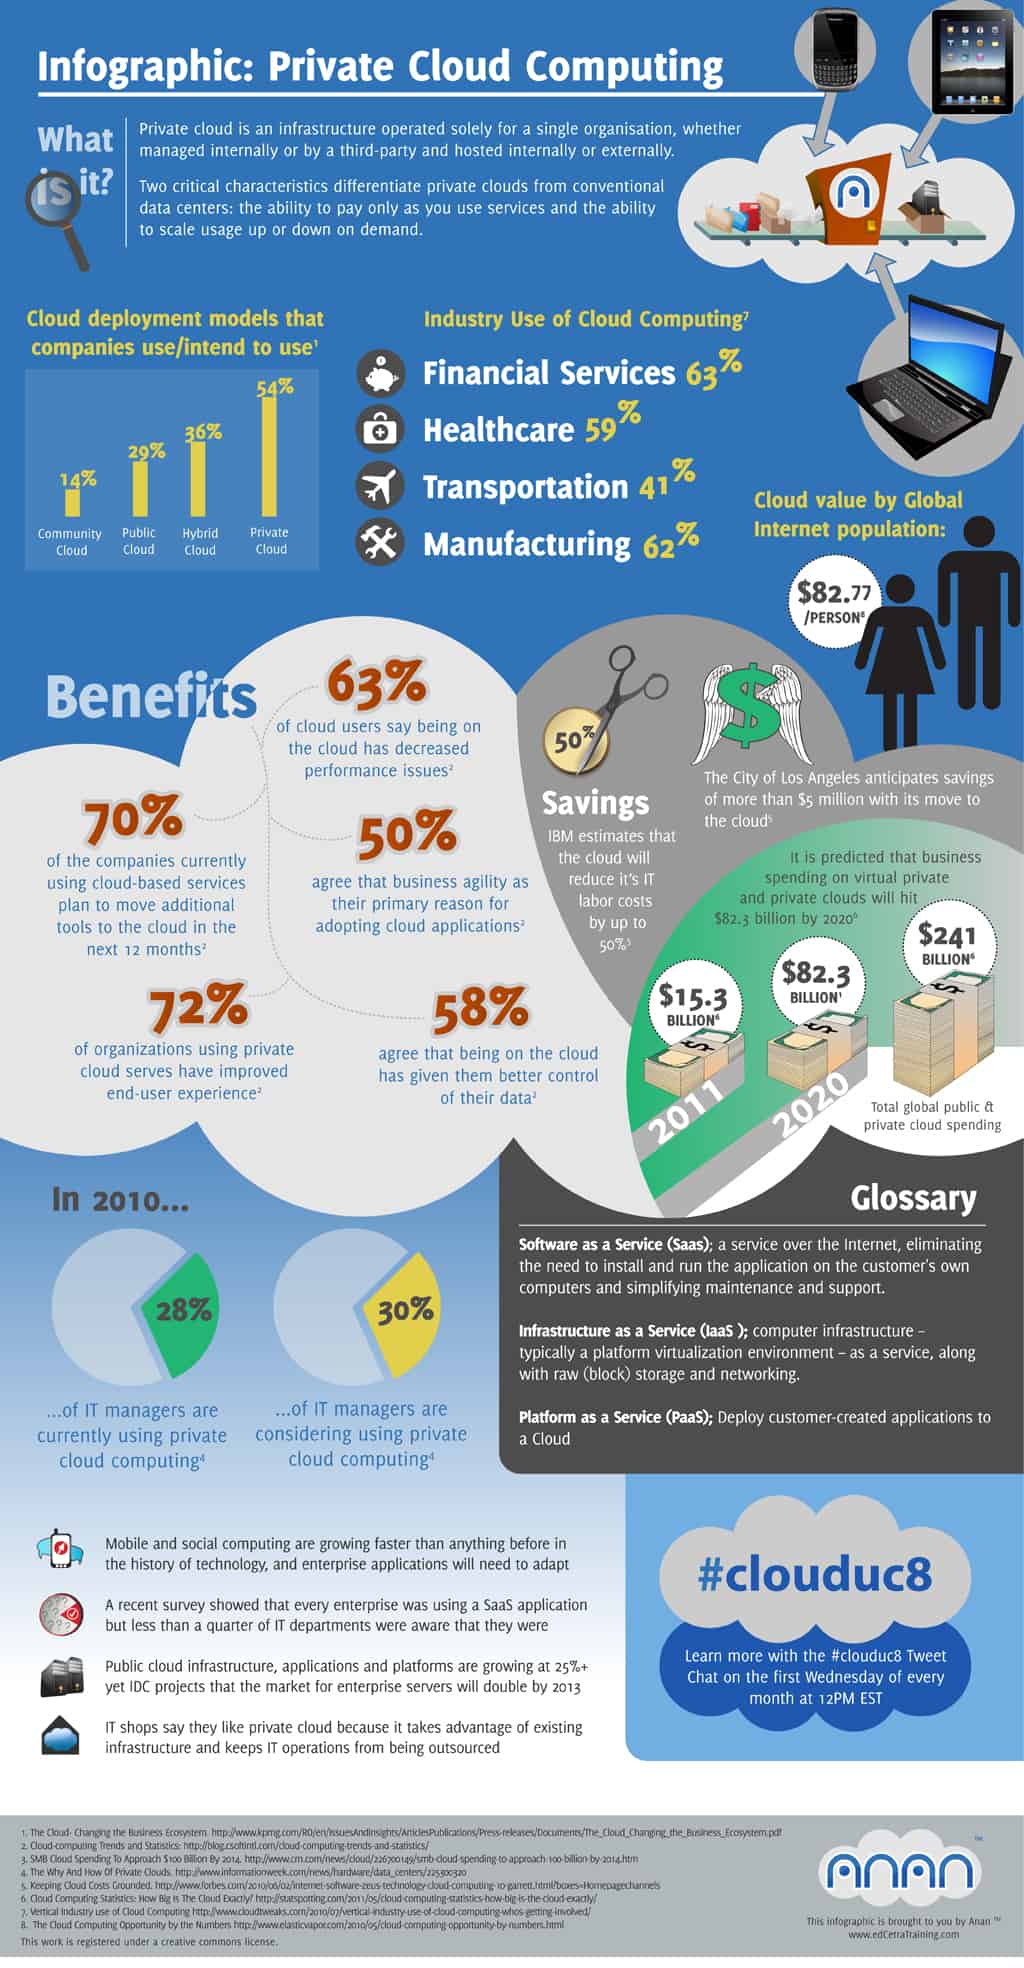
7. “Infographic: Private Cloud Computing”
Learning Solutions Magazine published an interesting infographic on the use of cloud computing by different industries called “Infographic: Private Cloud Computing.” The information here states that cloud computing increases performance levels, organization and data control. In addition, it says that it cuts costs, saving companies up to 50 percent in IT costs.

8. “Are Flashcards an Effective Learning Tool?”
Voxy Blog published an infogrpahic titled “Are Flashcards an Effective Learning Tool?” exploring the benefits of studying with flashcards and the apps available to do so on your iPhone. The infogrpahic looks at the ways that flashcards help to incorporate visual and auditory learning as an effective way to retain information in short intervals between study sessions. Also, with the help of new mobile apps, students don’t need to waste or keep track of stacks of index cards for studying.

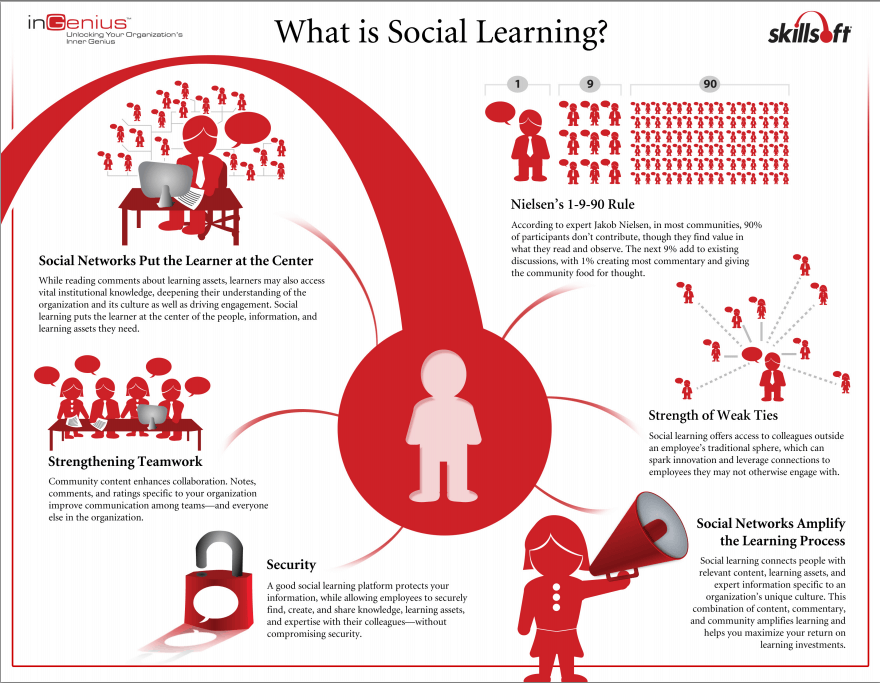
9. “What Is Social Learning?”
Overdrive Interactive published an infographic titled “What is Social Learning?” looking at Skillsoft’s Social Learning to create a people-centered, teamwork-based environment for learning and productivity. This graphic states that social networks amplify learning by connecting people to relevant content and experts on various topics. What’s unique about this infographic is that it has live links. So, be sure to click here to view it complete with the additional linked information.

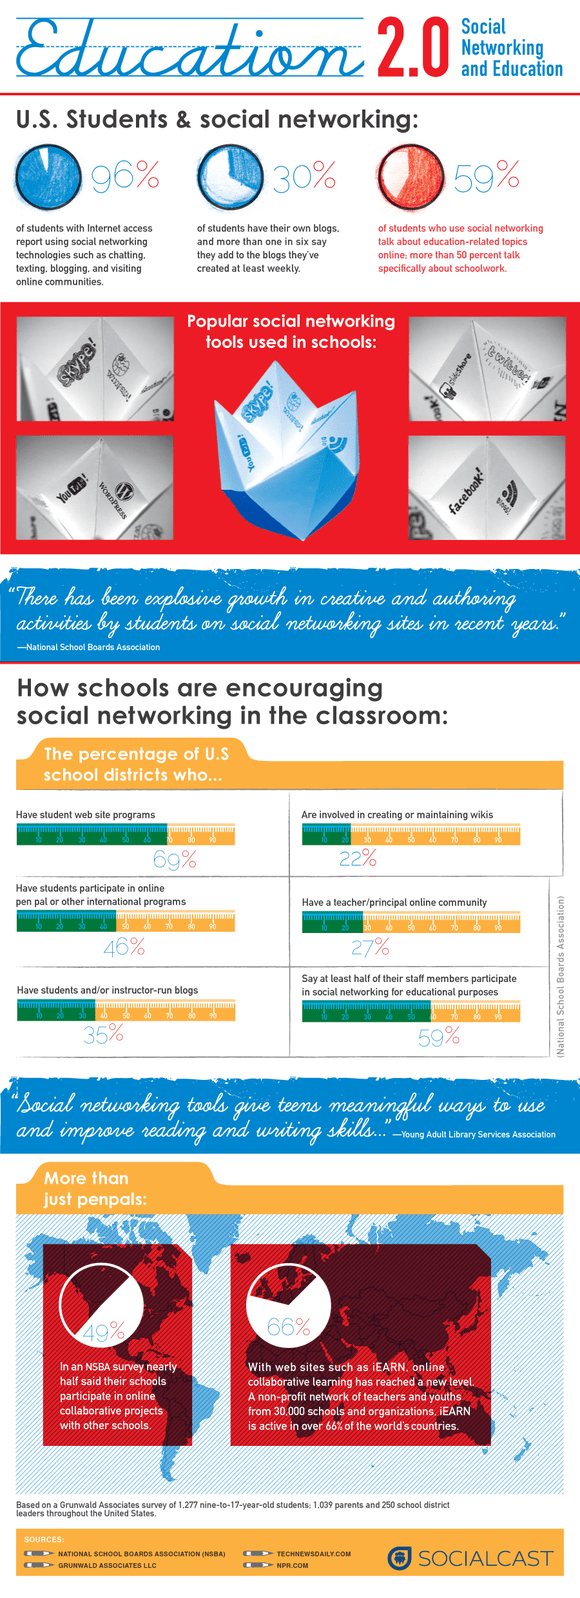
10. “Education 2.0: Social Networking & Education”
Socrato, a learning analytics blog, published the infographic “Education 2.0: Social Networking & Education” that looks at the ways students are using social networks and the ones that are popular at schools. The infographic suggests that social networking “gives meaningful ways to use and improve reading and writing skills.”

So, which infographic did you like best?


Ina Kruger
Thank you for sharing!
Christine
The Keeping Pace website and printed report offer a variety of infographics about online and blended learning. http://kpk12.com/reports/
New graphics to describe policies, practices, and trends across all 50 states are published each year.
Karla Kmetz
I found the inforgraphic on the "Evolution of Online Education Technologies" very interesting. I am always looking for good statistics about the growth of distance learning, this sums it up very nicely.