FLVS Students Outperform State Average In AP Courses
 Despite late claims that online and blended learning students are underperforming, Florida Virtual School® (FLVS) students are excelling at meeting global expectations in learning. FLVS announced today that students enrolled in its 15 Advanced Placement® (AP) courses outperformed Florida state averages by 12 percent, equal to global averages.

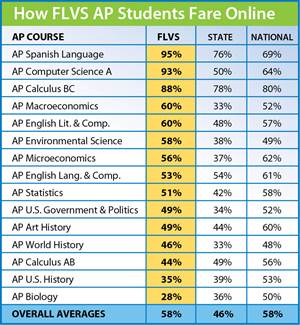
The table above demonstrates how FLVS students are outperforming state averages in the majority of courses available to students. FLVS also reports the follow results from the 2010-2011 school year:
- 3,053 FLVS students took an AP Exam, an 18 percent increase over the previous year
- 88 percent of FLVS AP enrolled students took the AP Exam in their respective courses
- 58 percent qualified with a score of 3, 4 or 5
- FLVS students were above the state qualifying AP averages in 11 of 15 courses
- FLVS students were above the global qualifying AP averages in six of the courses
- AP Environmental Science, in its first year at FLVS, surpassed the state qualifying average by 20 percent and the global average by 9 percent
- Minority students accounted for 46 percent of 2011 AP course enrollments


Kelly Gutensohn
I am not at all surprised, FLVS offers students the chance to actually LEARN the course material, allowing them mastery of subject matter. I have had a total of six children in FLVS, I think it is the best approach to education currently available in this country, and the teachers are definitely the best in their fields, encouraging, they give constant feedback and are always available for help, for each child it is like having a whole school system all to themselves.
Replies
Sarah Cargill
Thanks for your feedback, Kelly! We too are very impressed with the work that FLVS is doing in education.
CLAUDIA ARTEAGA
IM VERY PROUD TO MY KIDS PARTICIPATE AND LIKE TO BE ENROLL IN THIS SYSTEM. DAY BY DAY MANY NEW THINGS THAT IS INCREDIBLE HOW THEY LERAN MUCH MORE THAN BE IN A FULL DAY IN SCHOOL AND ACELERATE THE LEVEL AND THE ENTHUSIASM FOR STUDY.
I WISH MANY MORE PEOPLE CAN HAVE A CHANCE TO TRY THIS AREA .
Christine Bailiff
can you clarify the chart data please? what exactly does the percentage represent?
Replies
Sarah Cargill
Hi Christine, Thank you for your comment. Tania Clow at FLVS was able to clarify for me. She said, "The chart reflects the qualifying rate (AP Exam score of 3, 4 or 5) by course."
Christine Bailiff
Thank you Sarah. These are great results. I am very glad to hear about the FLVS participation in AP courses and exams, and will pass this info on to others I know who are interested.
Jason
Is there a way we can see actual numbers for the courses? Such as if AP Spanish got 95% pass rate how many students took that course? How many students took the AP Spanish Test vs. how many took that class? My Spanish III teacher is skeptical of this 95% pass rate and we would like to see the "real" data (ie. #of students that took the course).
Replies
Sarah Cargill
Hi Jason, This is a valid analysis of the data shown here. Unfortunately, I don't have access to the data you're requesting. I'll reach out to FLVS to see what I can find for you.
Sarah Cargill
Hi Jason, Here's the answers to your questions:
How many students took the AP Spanish course in the 2010-2011 school year?
71 students took the course
How many students took the AP Spanish Exam in 2011?
56 students took the exam
How many students received a qualifying score of 3, 4 or 5 for the 2011 AP Spanish Exam?
53 students or 95 percent qualified/passed with a score of 3, 4 or 5
Sonia Valenzuela
Hi Ms. Cargill,
I was very interested in taking AP Spanish Language; however, when it says that 46% of the students were minority students, do you know how many minority students/ native-speakers took the AP Spanish Language Class?